![]()

|
Jane's
Quick Tips |
|
Creating Charts |
|
PowerPoint comes with slide layouts that include placeholders for charts. To change your slide to one of these layouts, click Slide Layout on the Format menu, and then select a layout from the slide layout dialog box that contains a chart placeholder. Procedures:1. Click on the New Slide button, choose New Slide from
the Insert menu, or press Ctrl + M. |
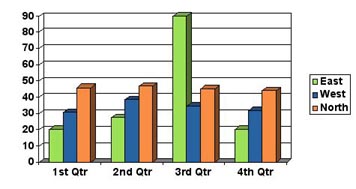
Changing the Chart Type |
|
You can change the chart type of an existing chart. PowerPoint offers many different chart types with multiple variations on each one. Procedures:1. Double-click the chart you want to edit. |
![]()
Back to PowerPoint 2002 Quick Tips Index
This page
was last modified March 1, 2004
Address of this page is: http://hhh.gavilan.edu/jmaringer/PowerPoint/PowerPoint2002/QuickTips2002/xptip13.html